


Traders often experience the frustration of seeing a trade move against them just after entering the market. Price movements can be unpredictable, and determining the right moment to stay in or exit a position is a constant challenge. To address this, technical analyst J. Welles Wilder Jr. also known for creating the Relative Strength Index (RSI) introduced the Parabolic Time/Price System, commonly referred to as the Parabolic SAR (Stop and Reverse) indicator.
The Parabolic SAR helps traders identify potential points where a trend might pause or reverse. It works by placing a series of dots above or below the price on a chart: dots below the price suggest an upward trend, while dots above the price indicate a downward trend. This visual system enables traders to follow the direction of the market and decide when it may be appropriate to switch from a long to a short position, or vice versa.
What is the parabolic SAR?
The Parabolic SAR is a trend-following indicator that helps traders identify both the direction of price movement and the potential points where that direction may change. On a price chart, it appears as a series of dots that are either above or below the price bars.
- When the dots appear below the price, the market is considered to be in a bullish phase.
- When the dots appear above the price, the market is in a bearish phase.
- When these dots switch sides, it signals a possible reversal.
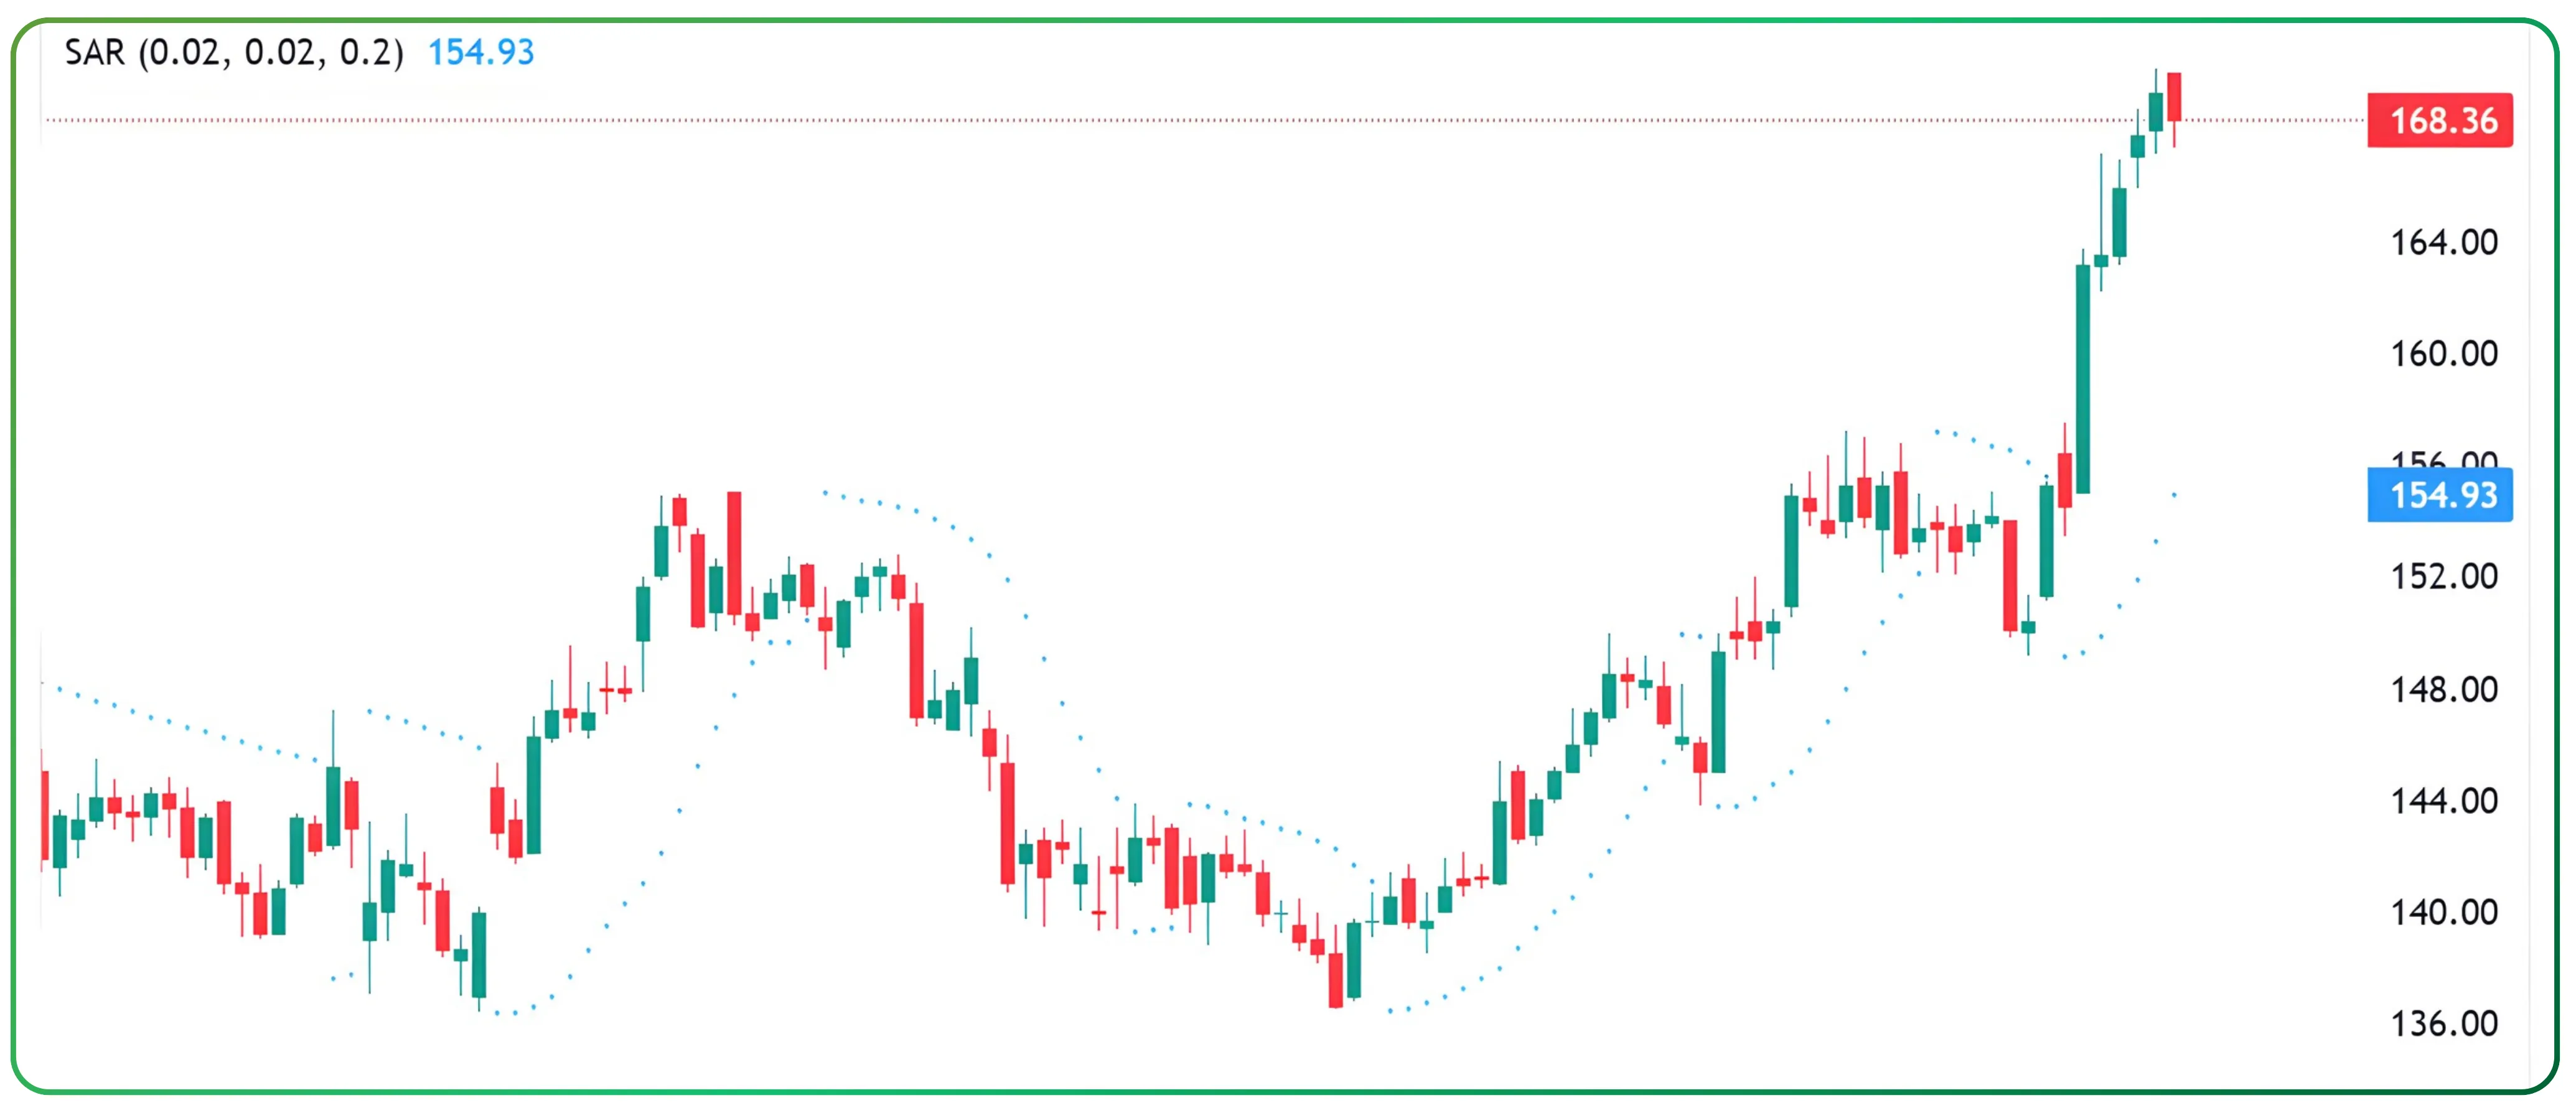
The Parabolic SAR acts like a co-pilot for your trade, tracking how far the price can move before a reversal might occur. Below image reflects the Parabolic SAR dots.
The concept behind the parabolic time
The Parabolic Time/Price System, developed by Wilder, works best in trending markets. The key idea is to determine the right time to exit a position using stop orders that move automatically with the trend.
Although the Parabolic SAR resembles a moving average in appearance, it has a major advantage: it includes a built-in trailing stop and reversal mechanism that adjusts in the direction of the price trend. This makes it a valuable tool for locking in profits and signaling potential reversals.
The SAR point depends on both price and time. For instance, in a long trade, the SAR point moves upward with positive price action and over time. In a short trade, it moves downward. Importantly, the SAR point never moves backward; it only advances in the direction of the trade.
When a new trade begins, the SAR value for the first day equals the Extreme Price (EP) of the previous trade. In a long trade, this EP is the lowest price reached during the previous short trade, and vice versa. This approach ensures that each reversal is based on the most recent significant market movement.
The mathematics behind the indicator
The Parabolic SAR is built around the Acceleration Factor (AF), which controls how closely the SAR points follow the price.
The AF starts at 0.02 and increases by 0.02 each time the market reaches a new high in an uptrend or a new low in a downtrend.
The AF stops increasing when it reaches 0.20, keeping the indicator from becoming too sensitive.
The Parabolic SAR is calculated as follows:
For an uptrend: PSAR = Previous PSAR + Previous AF × (Previous EP – Previous PSAR)
For a downtrend: PSAR = Previous PSAR – Previous AF × (Previous PSAR – Previous EP)
The Extreme Price (EP) represents the highest high in an uptrend or the lowest low in a downtrend. By combining both price and time, the Parabolic SAR accelerates during strong trends and slows during weaker ones, allowing it to adapt to changing market momentum.
Why it is called “parabolic” and ‘stop and reverse’
The name Parabolic refers to the curved pattern that the indicator forms on a price chart, trailing the market in a parabolic shape. The phrase “Stop and Reverse” describes its automatic reversal feature:
When the price reaches the SAR point, traders are advised to close their current position and open one in the opposite direction.
For example:
If you are long and the price falls to the SAR point, that is the signal to stop and go short.
If you are short and the price rises to the SAR point, that is the cue to stop and go long.
In this way, traders can manage trades continuously without second-guessing their exit or entry points.
How traders use the parabolic SAR
1.As a trailing stop loss and buy and sell
Traders often use the dots as a dynamic stop loss. When the price moves in favor of a trade, the SAR dots trail the price, helping to lock in profits while keeping risk under control.
Also can be used when the dots shift from above to below the price, it can be used as a buy signal. When they shift from below to above, it can serve as a sell or short signal.
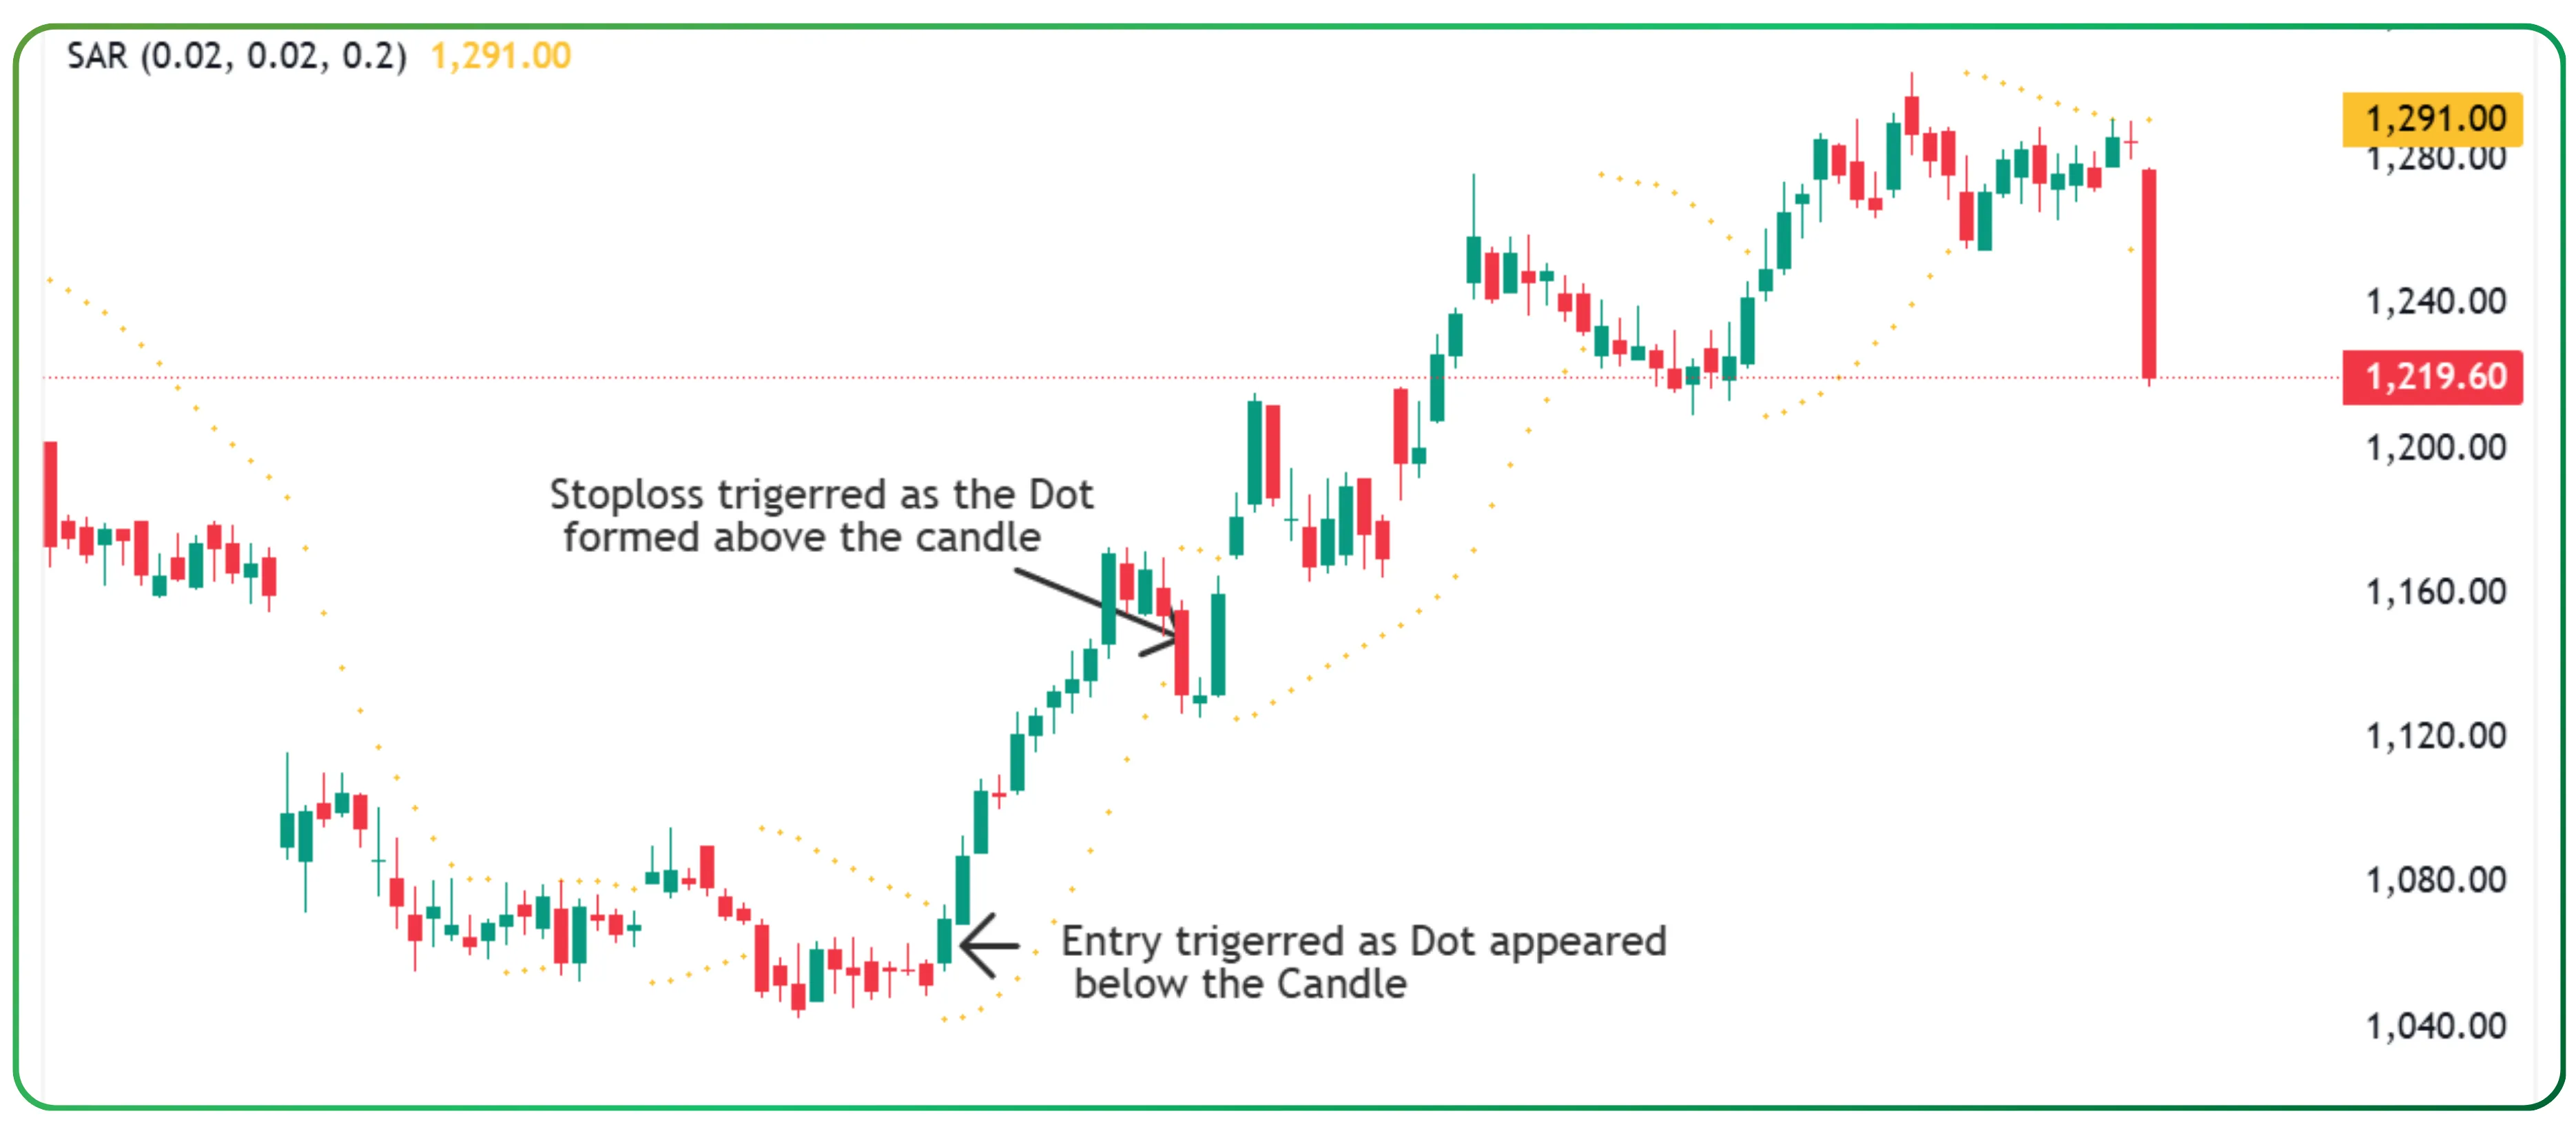
On Axis Bank’s chart, the SAR dots formed below the candle on 10th September, indicating a potential buy entry at ₹1,060. As the trend progressed, the dots continued to trail below the price, suggesting that the uptrend was intact. By 29th September, however, a dot appeared above the candle, signaling a possible reversal and an exit point at ₹1,156.
This trade resulted in a gain of about ₹96 per share, showing how effectively the Parabolic SAR can help traders trail their stop loss and protect profits as the trend evolves.
2. As a trend confirmation Tool
The Parabolic SAR can be combined with other indicators such as the Moving Average, Relative Strength Index (RSI), or Average Directional Index (ADX) to confirm whether a trend is strong enough to act upon.
When the price trades above the SAR, traders can consider going long. When the price trades below the SAR, traders can consider going short. This simple rule helps identify the direction of the prevailing trend.
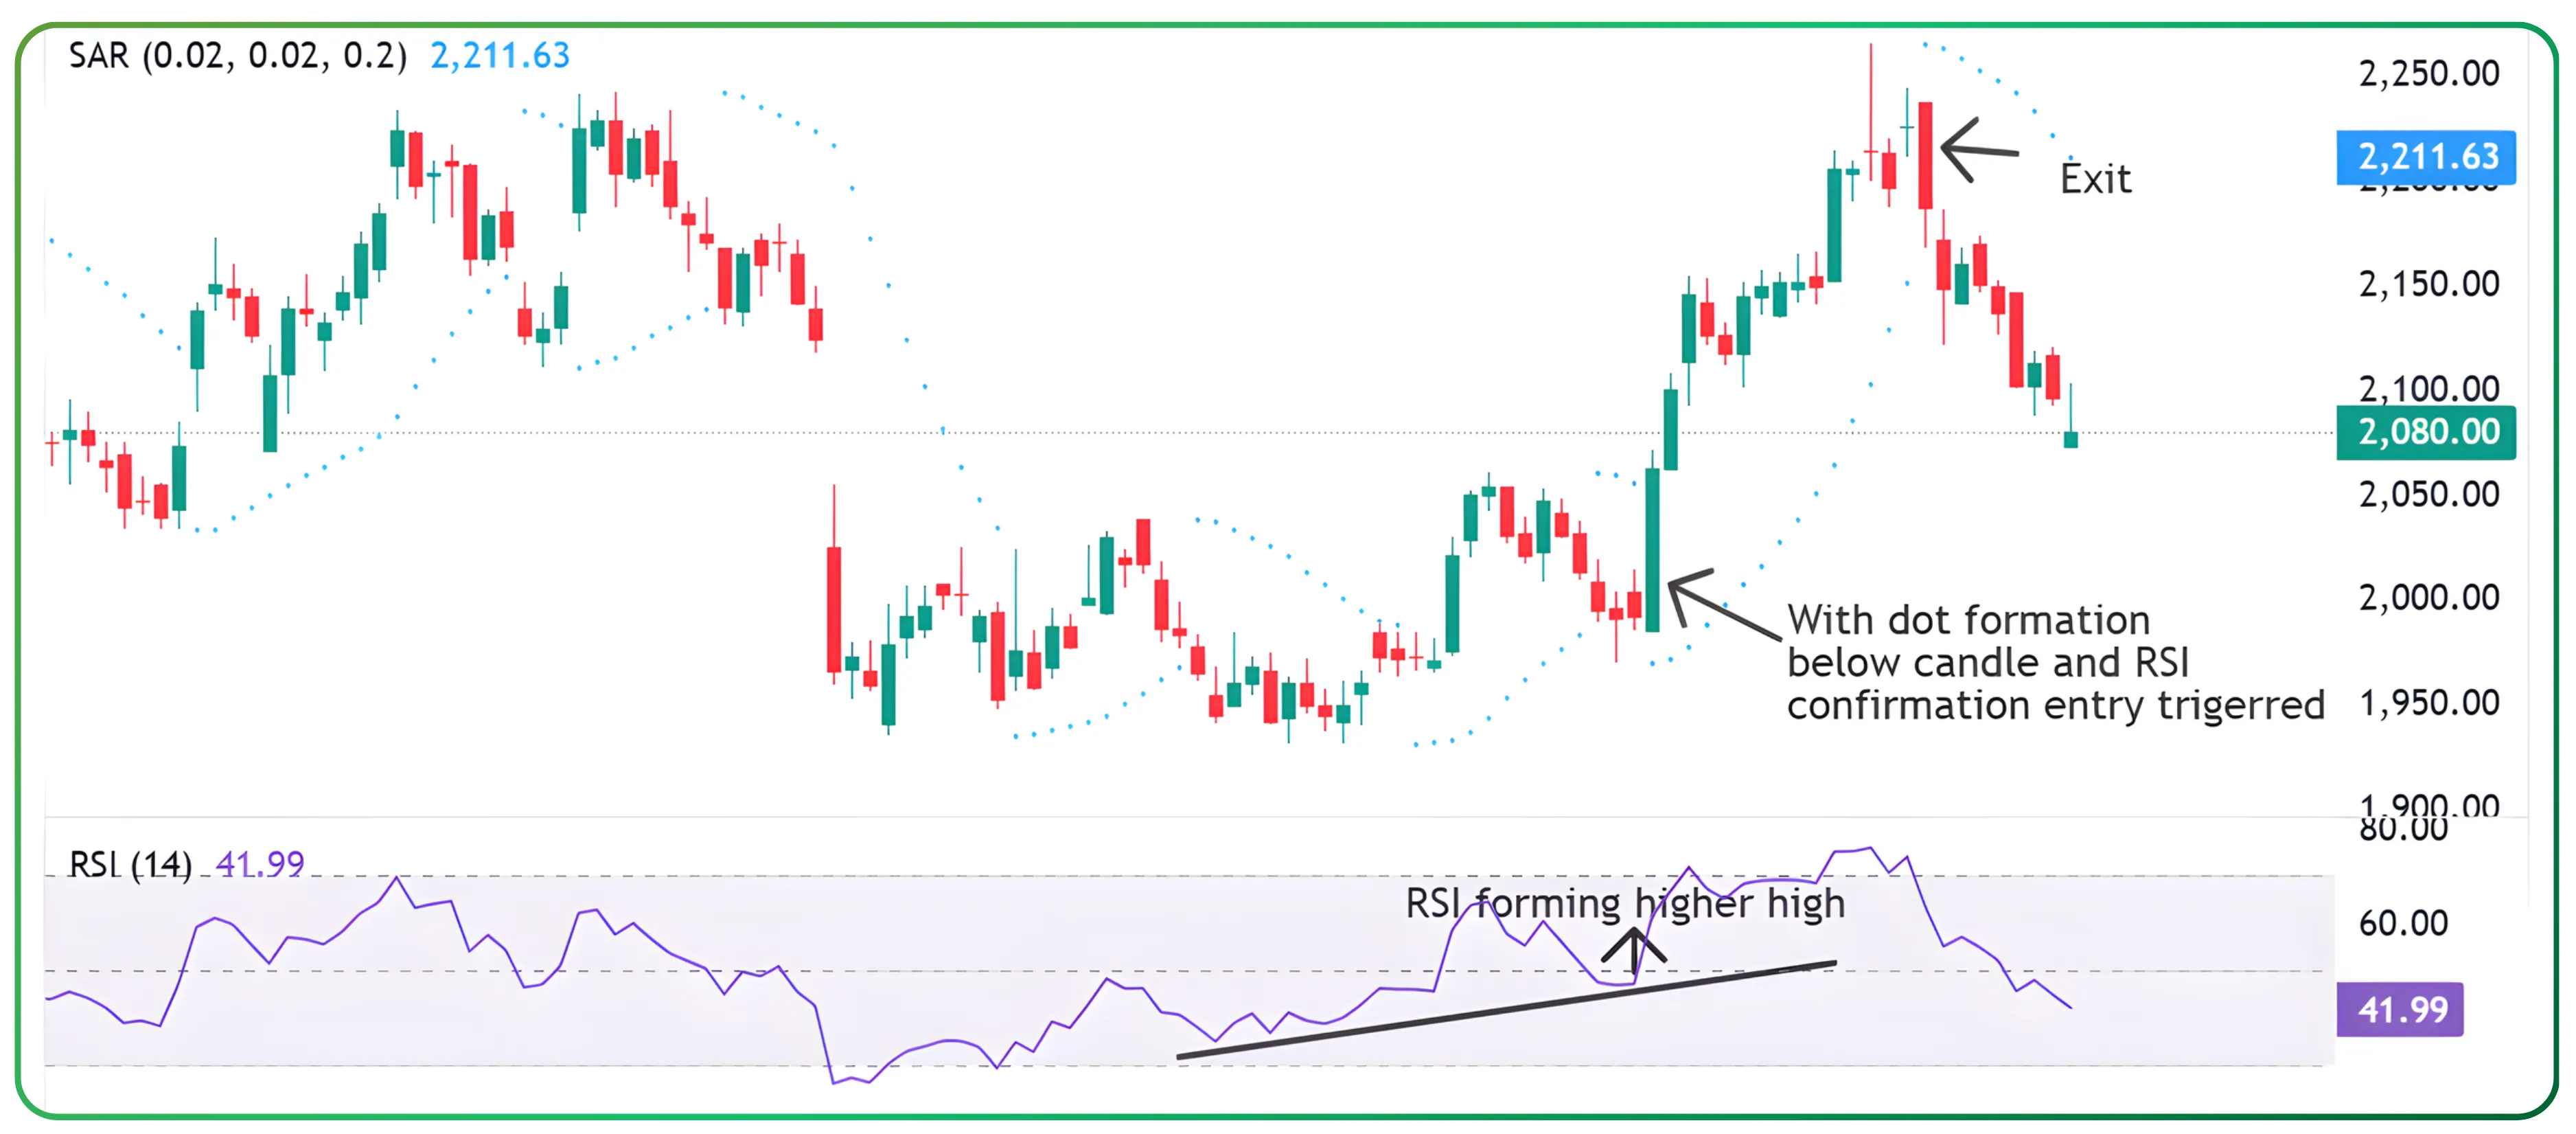
Since 30th July, Kotak Bank’s stock began forming a series of higher highs on the RSI relative strength indicator, indicating growing strength in the price trend. On 1st October, a strong bullish candle appeared, and the Parabolic SAR dots formed below the candle, confirming the start of a bullish phase and triggering a buy entry around ₹2,060.
As the uptrend continued, the price moved steadily higher until 24th October, when the RSI entered the overbought zone and the Parabolic SAR dots shifted above the candle, signaling a potential reversal. This provided an exit signal near ₹2,237, resulting in a gain of approximately ₹177 per share.
This example shows how combining Parabolic SAR with indicators like RSI can help traders confirm entries, manage exits, and capture trend-based gains effectively.
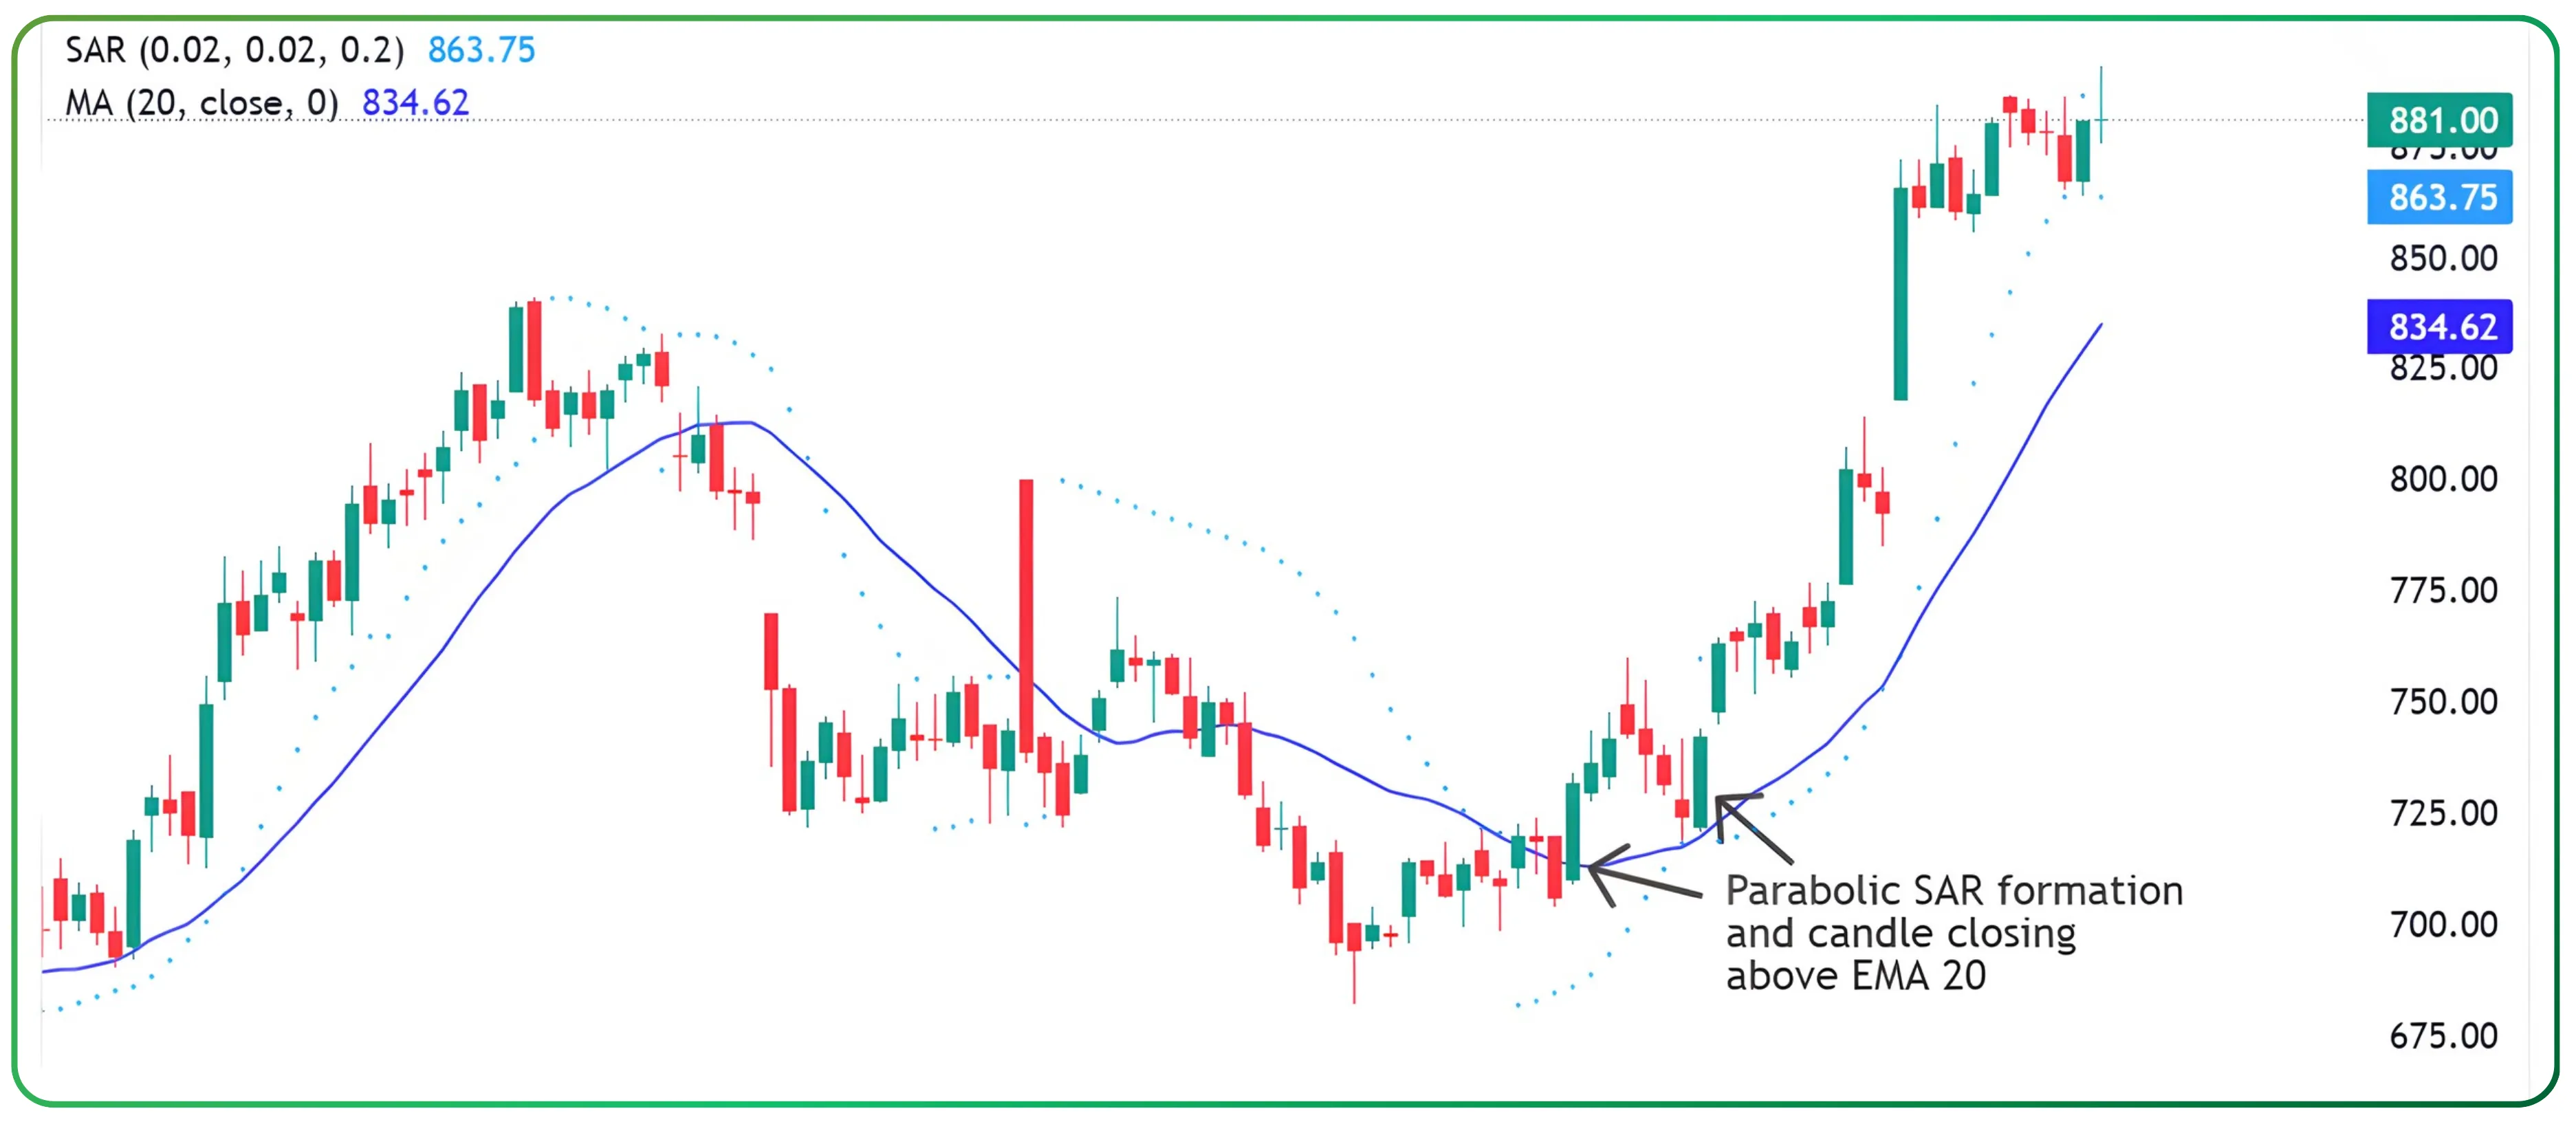
In the case of AUBANK, a trading opportunity appeared on 23rd September, when the Parabolic SAR dots formed below the candle, indicating a potential bullish setup. On the same day, the candle closed above the moving average (MA 20), providing additional confirmation of upward momentum.
Getting an entry signal supported by both the Parabolic SAR and the moving average increases the reliability of the trade. It is generally considered a good practice to confirm a signal with another indicator before entering a position, as this helps improve accuracy and confidence in the trading decision.
When to be cautious
While the Parabolic SAR performs well in strong trends, it can generate false signals in sideways or choppy markets . Therefore, it is wise to pair it with indicators that measure trend strength, such as the ADX, or momentum indicators like the RSI.
The Parabolic SAR should not be viewed as a prediction tool but rather as a systematic framework that guides traders to make decisions based on structure instead of emotion.
It is also important to observe the distance between the Parabolic SAR dots and the price candles. Ideally, the dots should appear close to the candles, indicating that the indicator is in sync with the price movement. When the dots are too far away, it suggests weaker momentum, and such setups are generally not suitable for new entries. Traders should wait until the dots move closer to the price before considering a position, ensuring better timing and stronger confirmation of the trend.
Strategic value of parabolic SAR
The Parabolic SAR remains one of the most practical tools for traders who want to balance capturing large moves with protecting profits. It helps traders stay aligned with the market’s direction, manage risk efficiently, and maintain discipline in their trading decisions.
The next time you notice those small dots curving across your price chart, remember that they represent more than just data points. They reflect the rhythm of the market, guiding you on when to stay with the trend and when to reverse direction.
Disclaimer: The information provided in our blogs is for informational purposes only and should not be construed as financial, investment, or trading advice. Trading and investing in the securities market carries risk. Always conduct your own research and consult with a qualified financial advisor before making any investment decisions. Past performance is not indicative of future results. Copyrighted and original content for your trading and investing needs.
© 2025 — Tradejini. All Rights Reserved.