


When it comes to momentum indicators, traders often look for tools that can help them time their entries and exits with better trading confidence. One such powerful tool in technical analysis is the Commodity Channel Index (CCI). Though originally designed for commodities by Donald Lambert, the CCI has now become a popular momentum oscillator across stocks, indices, and even forex markets.
What does CCI measure?
The CCI indicator measures price momentum by showing how far a security’s price has moved away from its moving average value. In simple terms, it highlights when the market is trading at unusually high or unusually low levels compared to its recent average.
The calculation uses a moving average and mean deviation, creating values that oscillate around a central zero line.
High positive values → Price is unusually strong compared to its average.
Low negative values → Price is unusually weak compared to its average.
Because of this structure, the CCI is especially effective in markets with cyclical tendencies, where spotting shifts in cycles or seasonal trends can provide valuable trading signals.
CCI vs RSI
| Feature | CCI (Commodity Channel Index) | RSI (Relative Strength Index) |
|---|---|---|
| Type | Momentum oscillator | Momentum oscillator |
| Range | Unbounded (values can go above +100 or below –100) | Bounded between 0 and 100 |
| Sensitivity | More sensitive to price changes; can give earlier signals | Less sensitive, smoother signals |
| Overbought/Oversold Levels | Typically +100 (overbought), –100 (oversold) | Typically above 70 (overbought), below 30 (oversold) |
| Signal Usage | Good for detecting extreme momentum shifts or potential reversals | Good for clear, consistent overbought/oversold identification |
| Best Use | Early detection of trend changes; spotting divergences | Confirmation of momentum strength; defining trading zones |
| Trading Style Fit | Suits aggressive traders who want quicker signals | Suits conservative traders who prefer reliability |
How to read a CCI chart
The CCI typically moves between +100 and –100. Traders interpret these levels as:
Above +100 → Market considered overbought.
Below –100 → Market considered oversold.
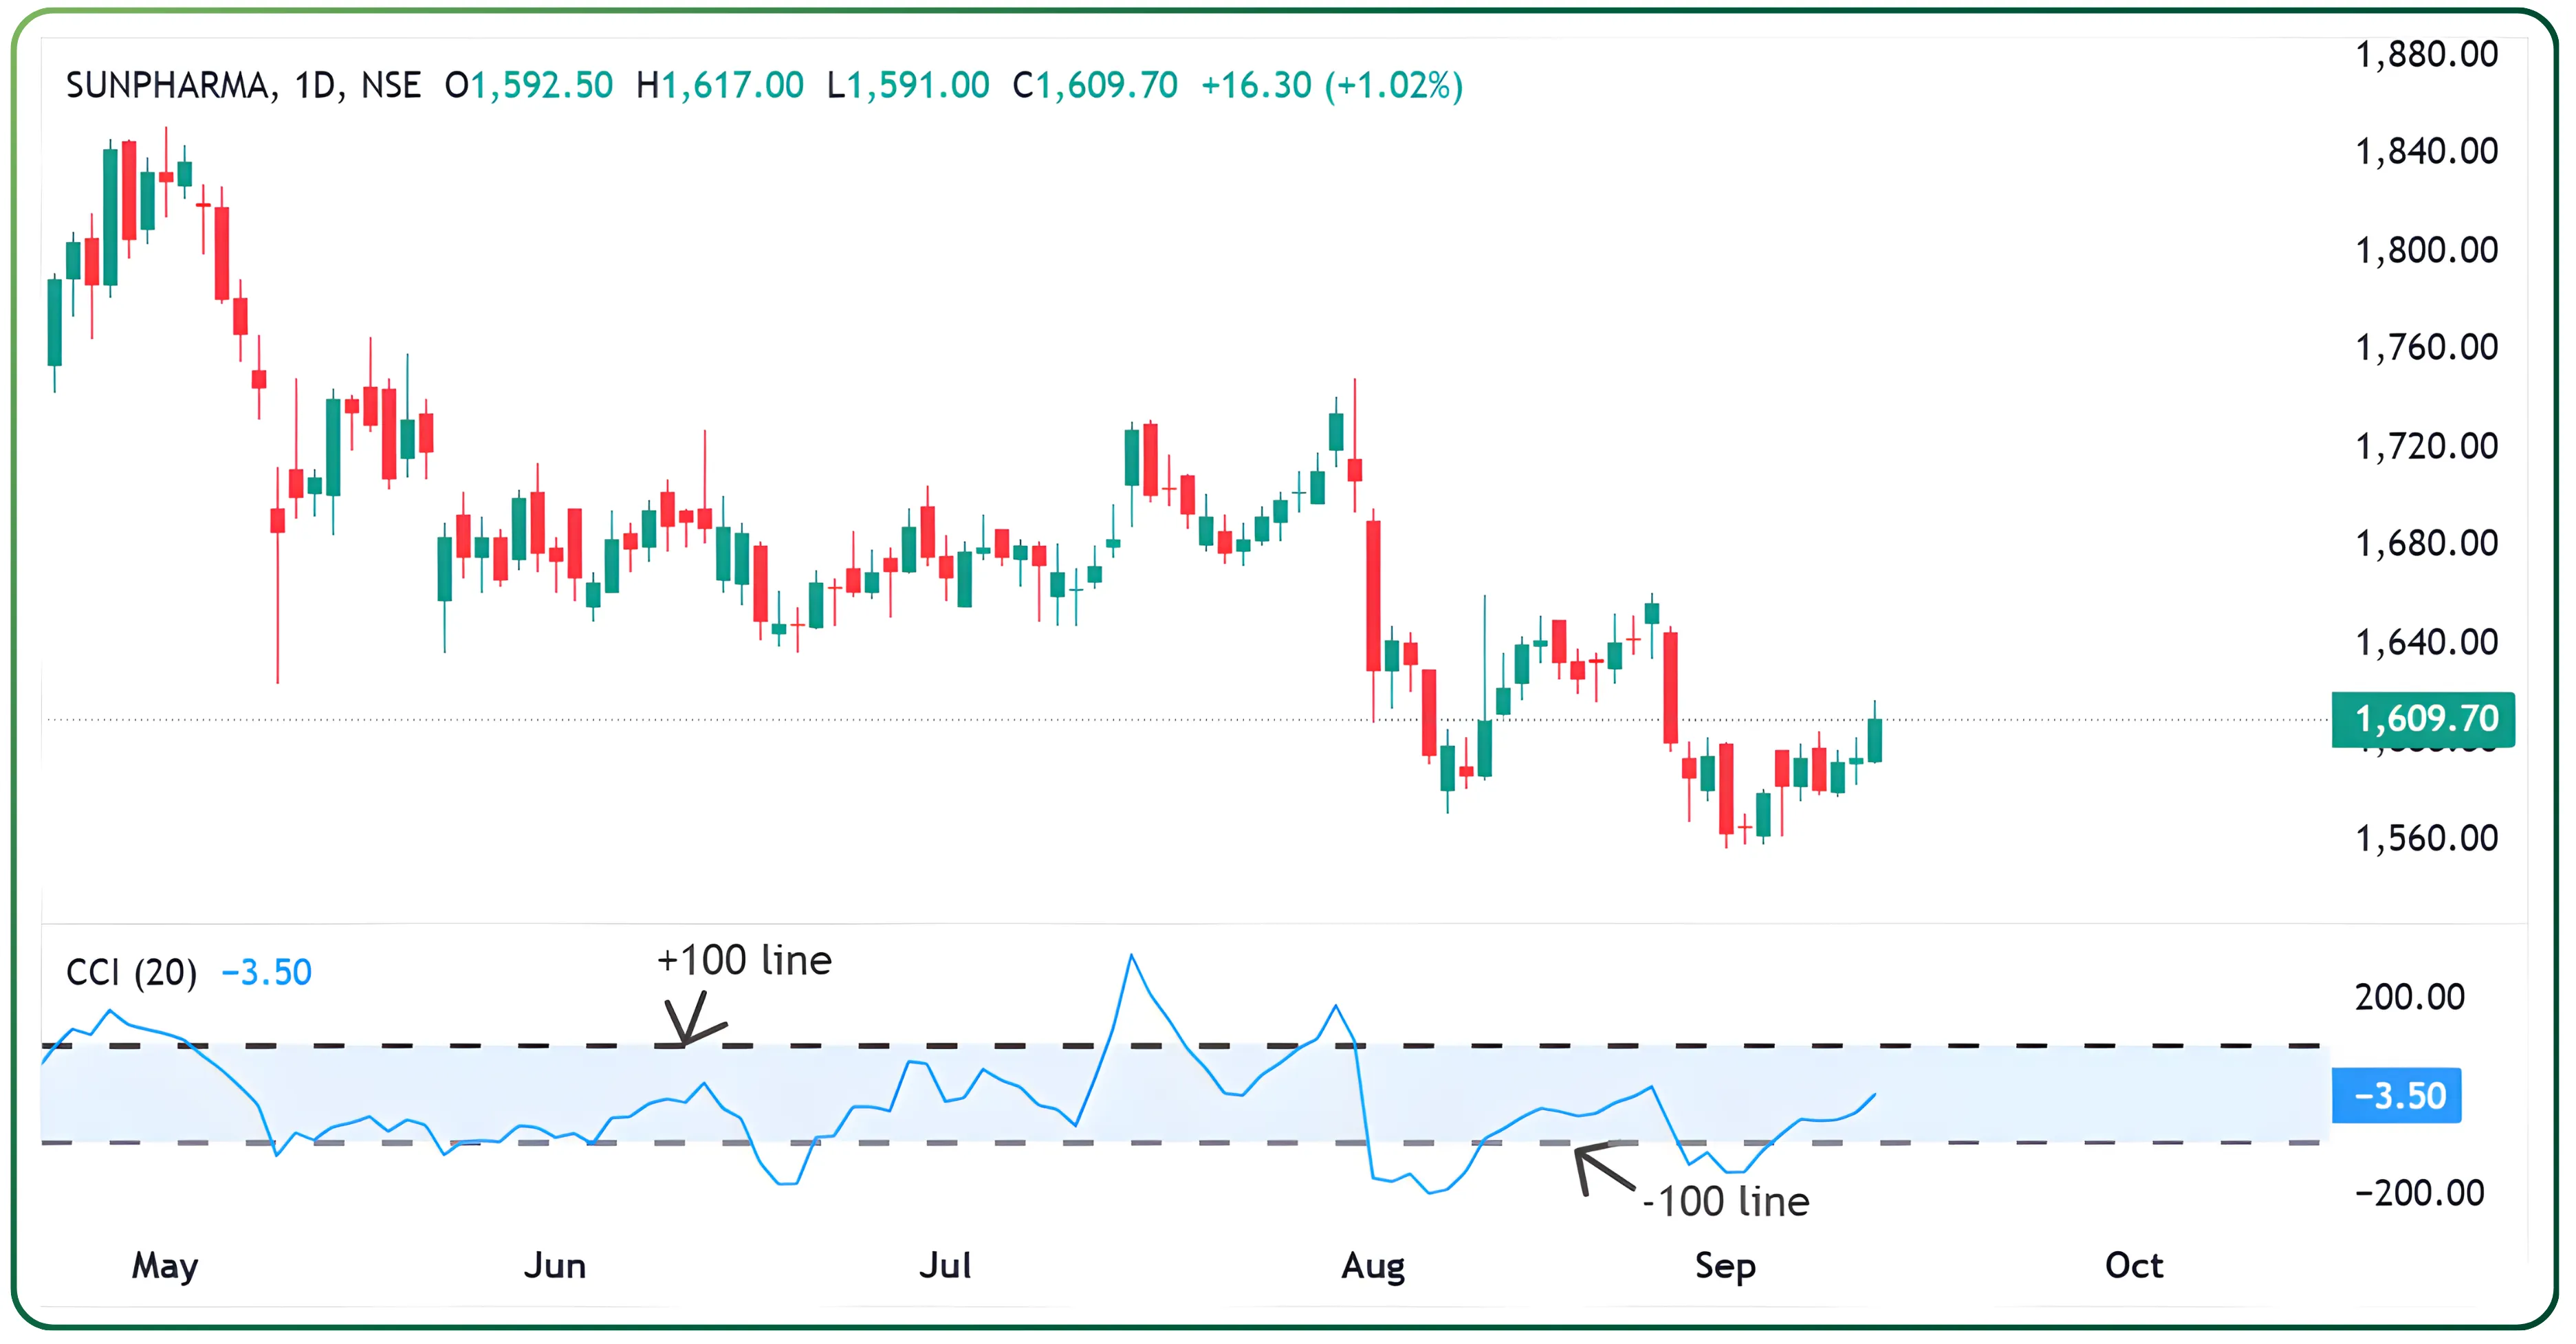
The most common CCI trading rules involve waiting for the indicator to move into these zones and then reverse direction. For example, if CCI crosses +100 and then declines, it may signal fading momentum. Likewise, a dip below –100 followed by a bounce upward suggests weakening selling pressure.
Also read: Hull Moving Average vs.Traditional Averages
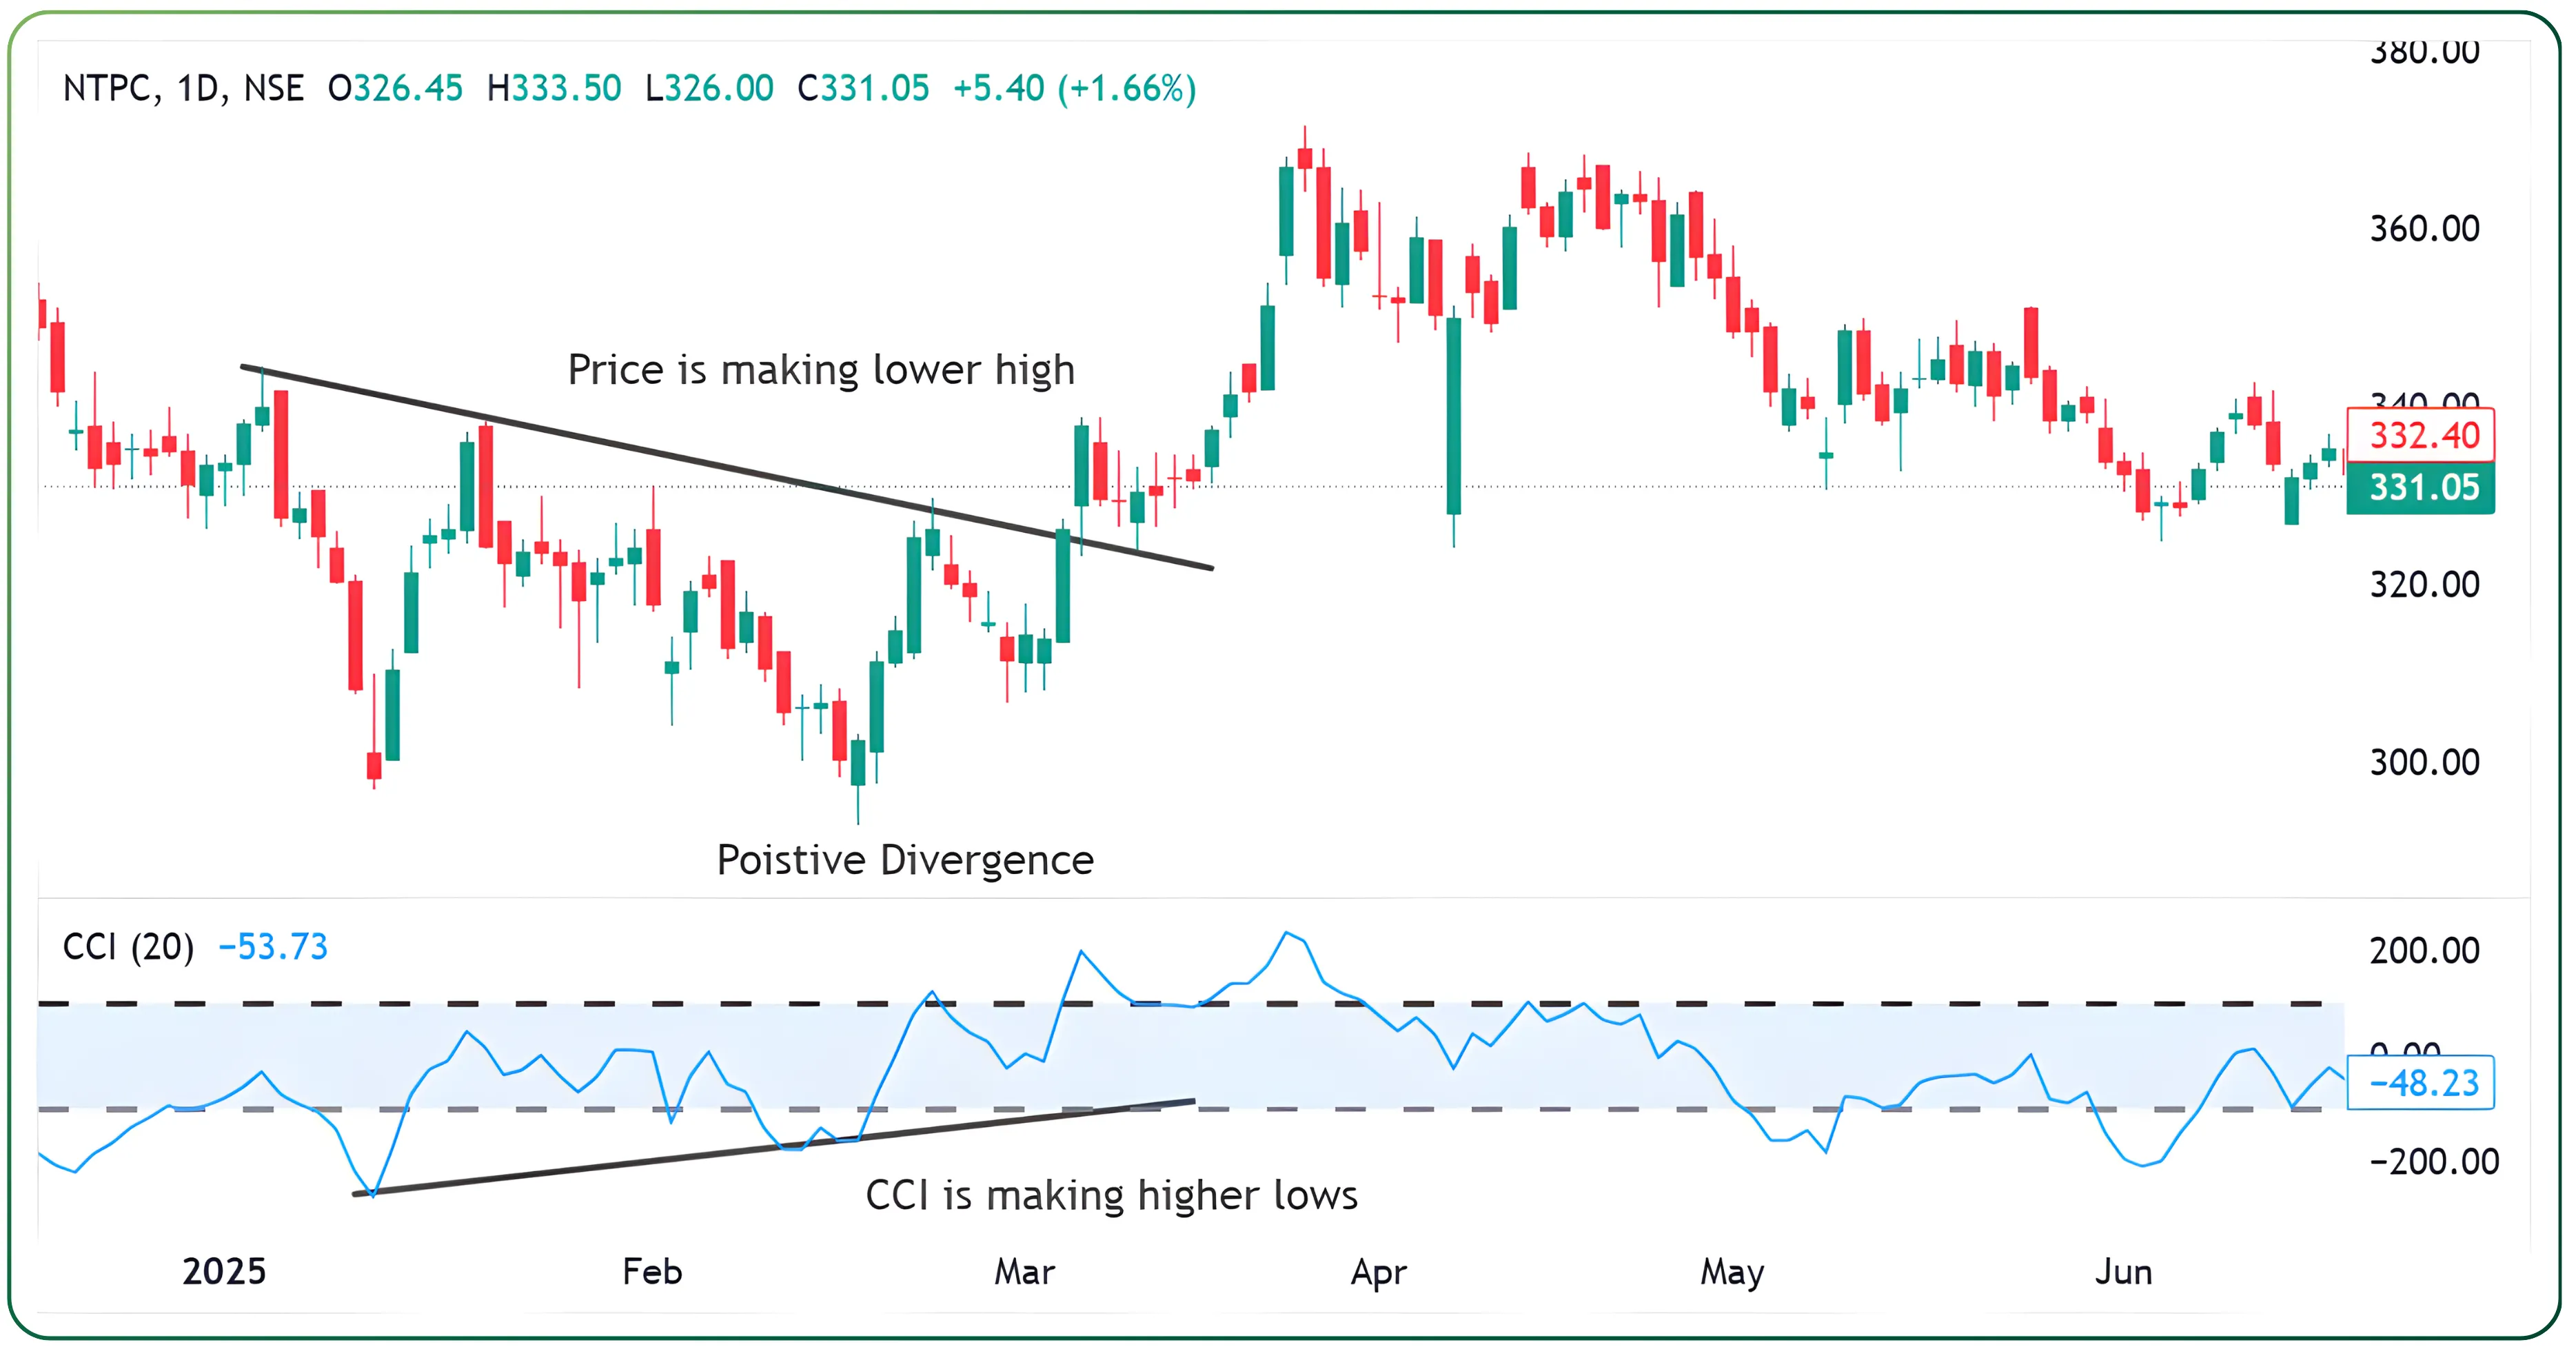
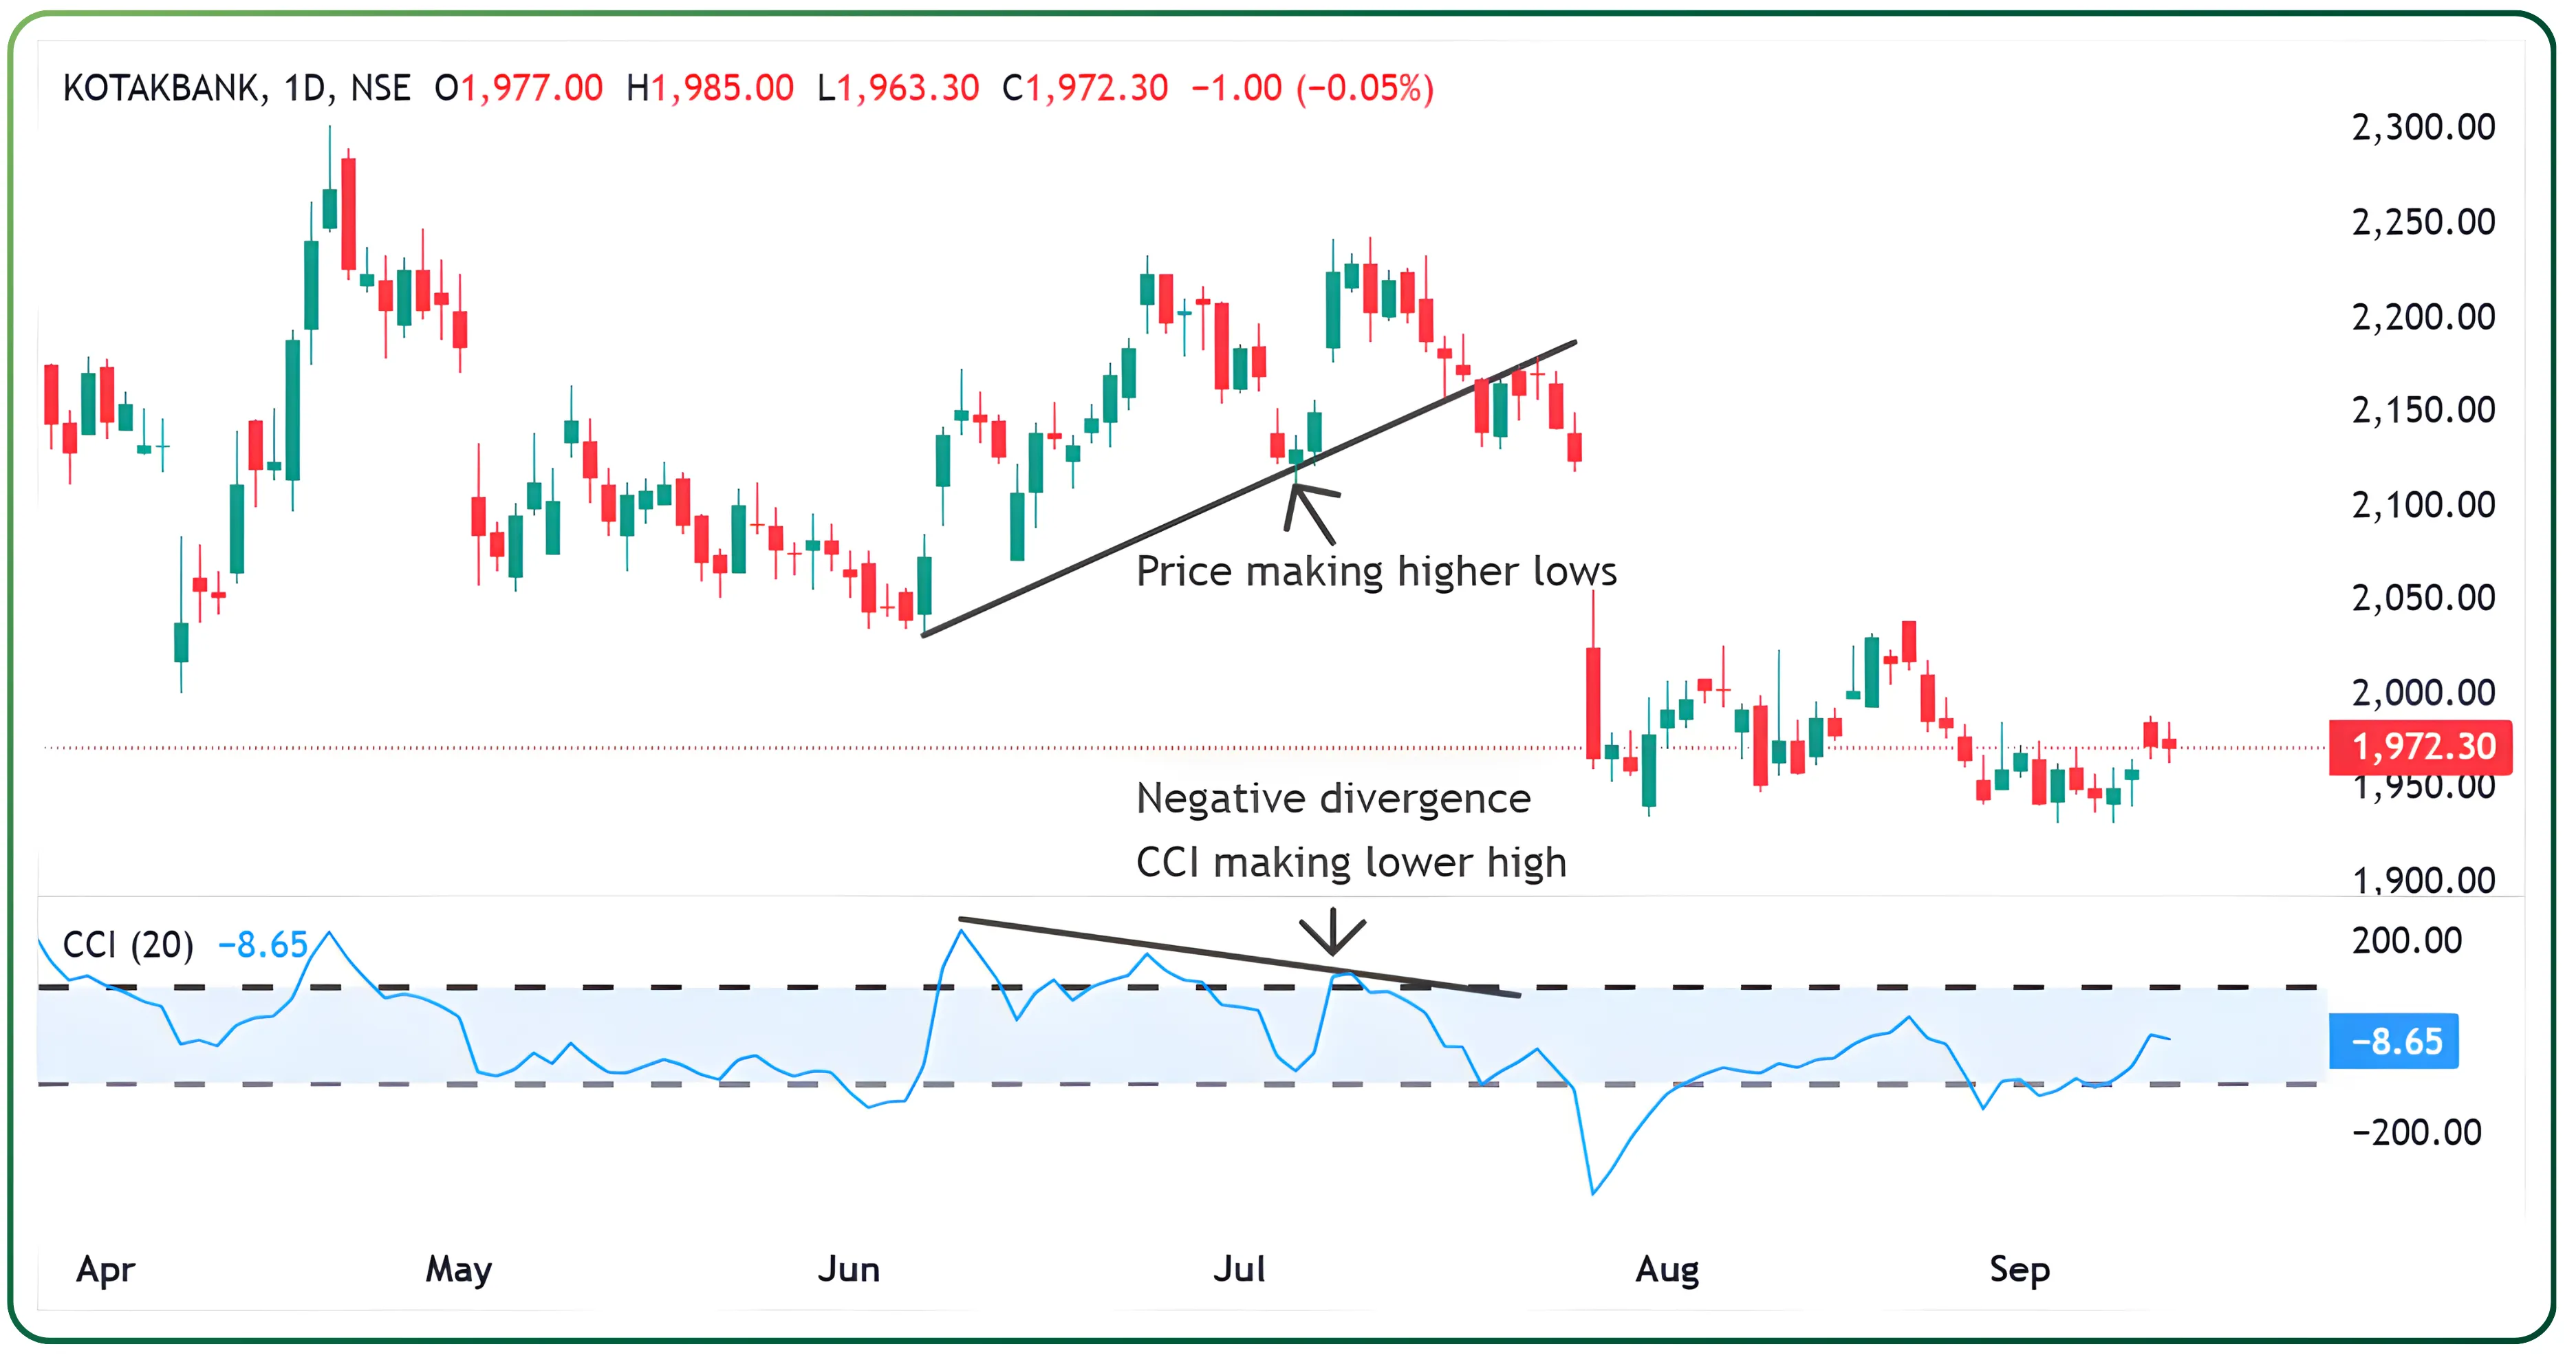
Divergences and trading signals
Divergences between price and the CCI provide some of the strongest signals in stock trading:
- If price makes new highs but CCI fails to do so, momentum is slowing, hinting at a potential trend reversal.
- If price makes new lows but CCI shows higher lows, it suggests sellers are losing control and a reversal may follow.
These divergences work best when paired with support and resistance analysis or moving averages, improving accuracy and filtering out false signals.
On the NTPC chart from 3rd January 2025 to 5th March 2025, the price was forming lower highs, suggesting a weakening trend. In contrast, the CCI was making higher lows, creating a bullish divergence and indicating that momentum was strengthening.
For traders already holding long positions, this divergence provided confidence to stay invested. For fresh entries, a buy signal was triggered around ₹330, with the exit target set near ₹371, which aligned with a previous resistance zone. This trade delivered a potential gain of about 41 points.
Also Read : A Reliable Intraday Gap-Up & Gap-Down Strategy Using the 20 EMA
On the Kotak Bank chart between 6th June 2025 and 16th July 2025, price action was forming higher lows, indicating an uptrend. However, the CCI was making lower highs, showing bearish divergence and signaling that momentum was weakening.
For traders already holding long positions, this acted as an early exit signal. For those looking to go short, a potential short entry was around ₹2,145, with a target near the support level of ₹2,000 giving a possible gain of about 145 points. Alternatively, traders could choose to trail stop losses to lock in profits, depending on their strategy.
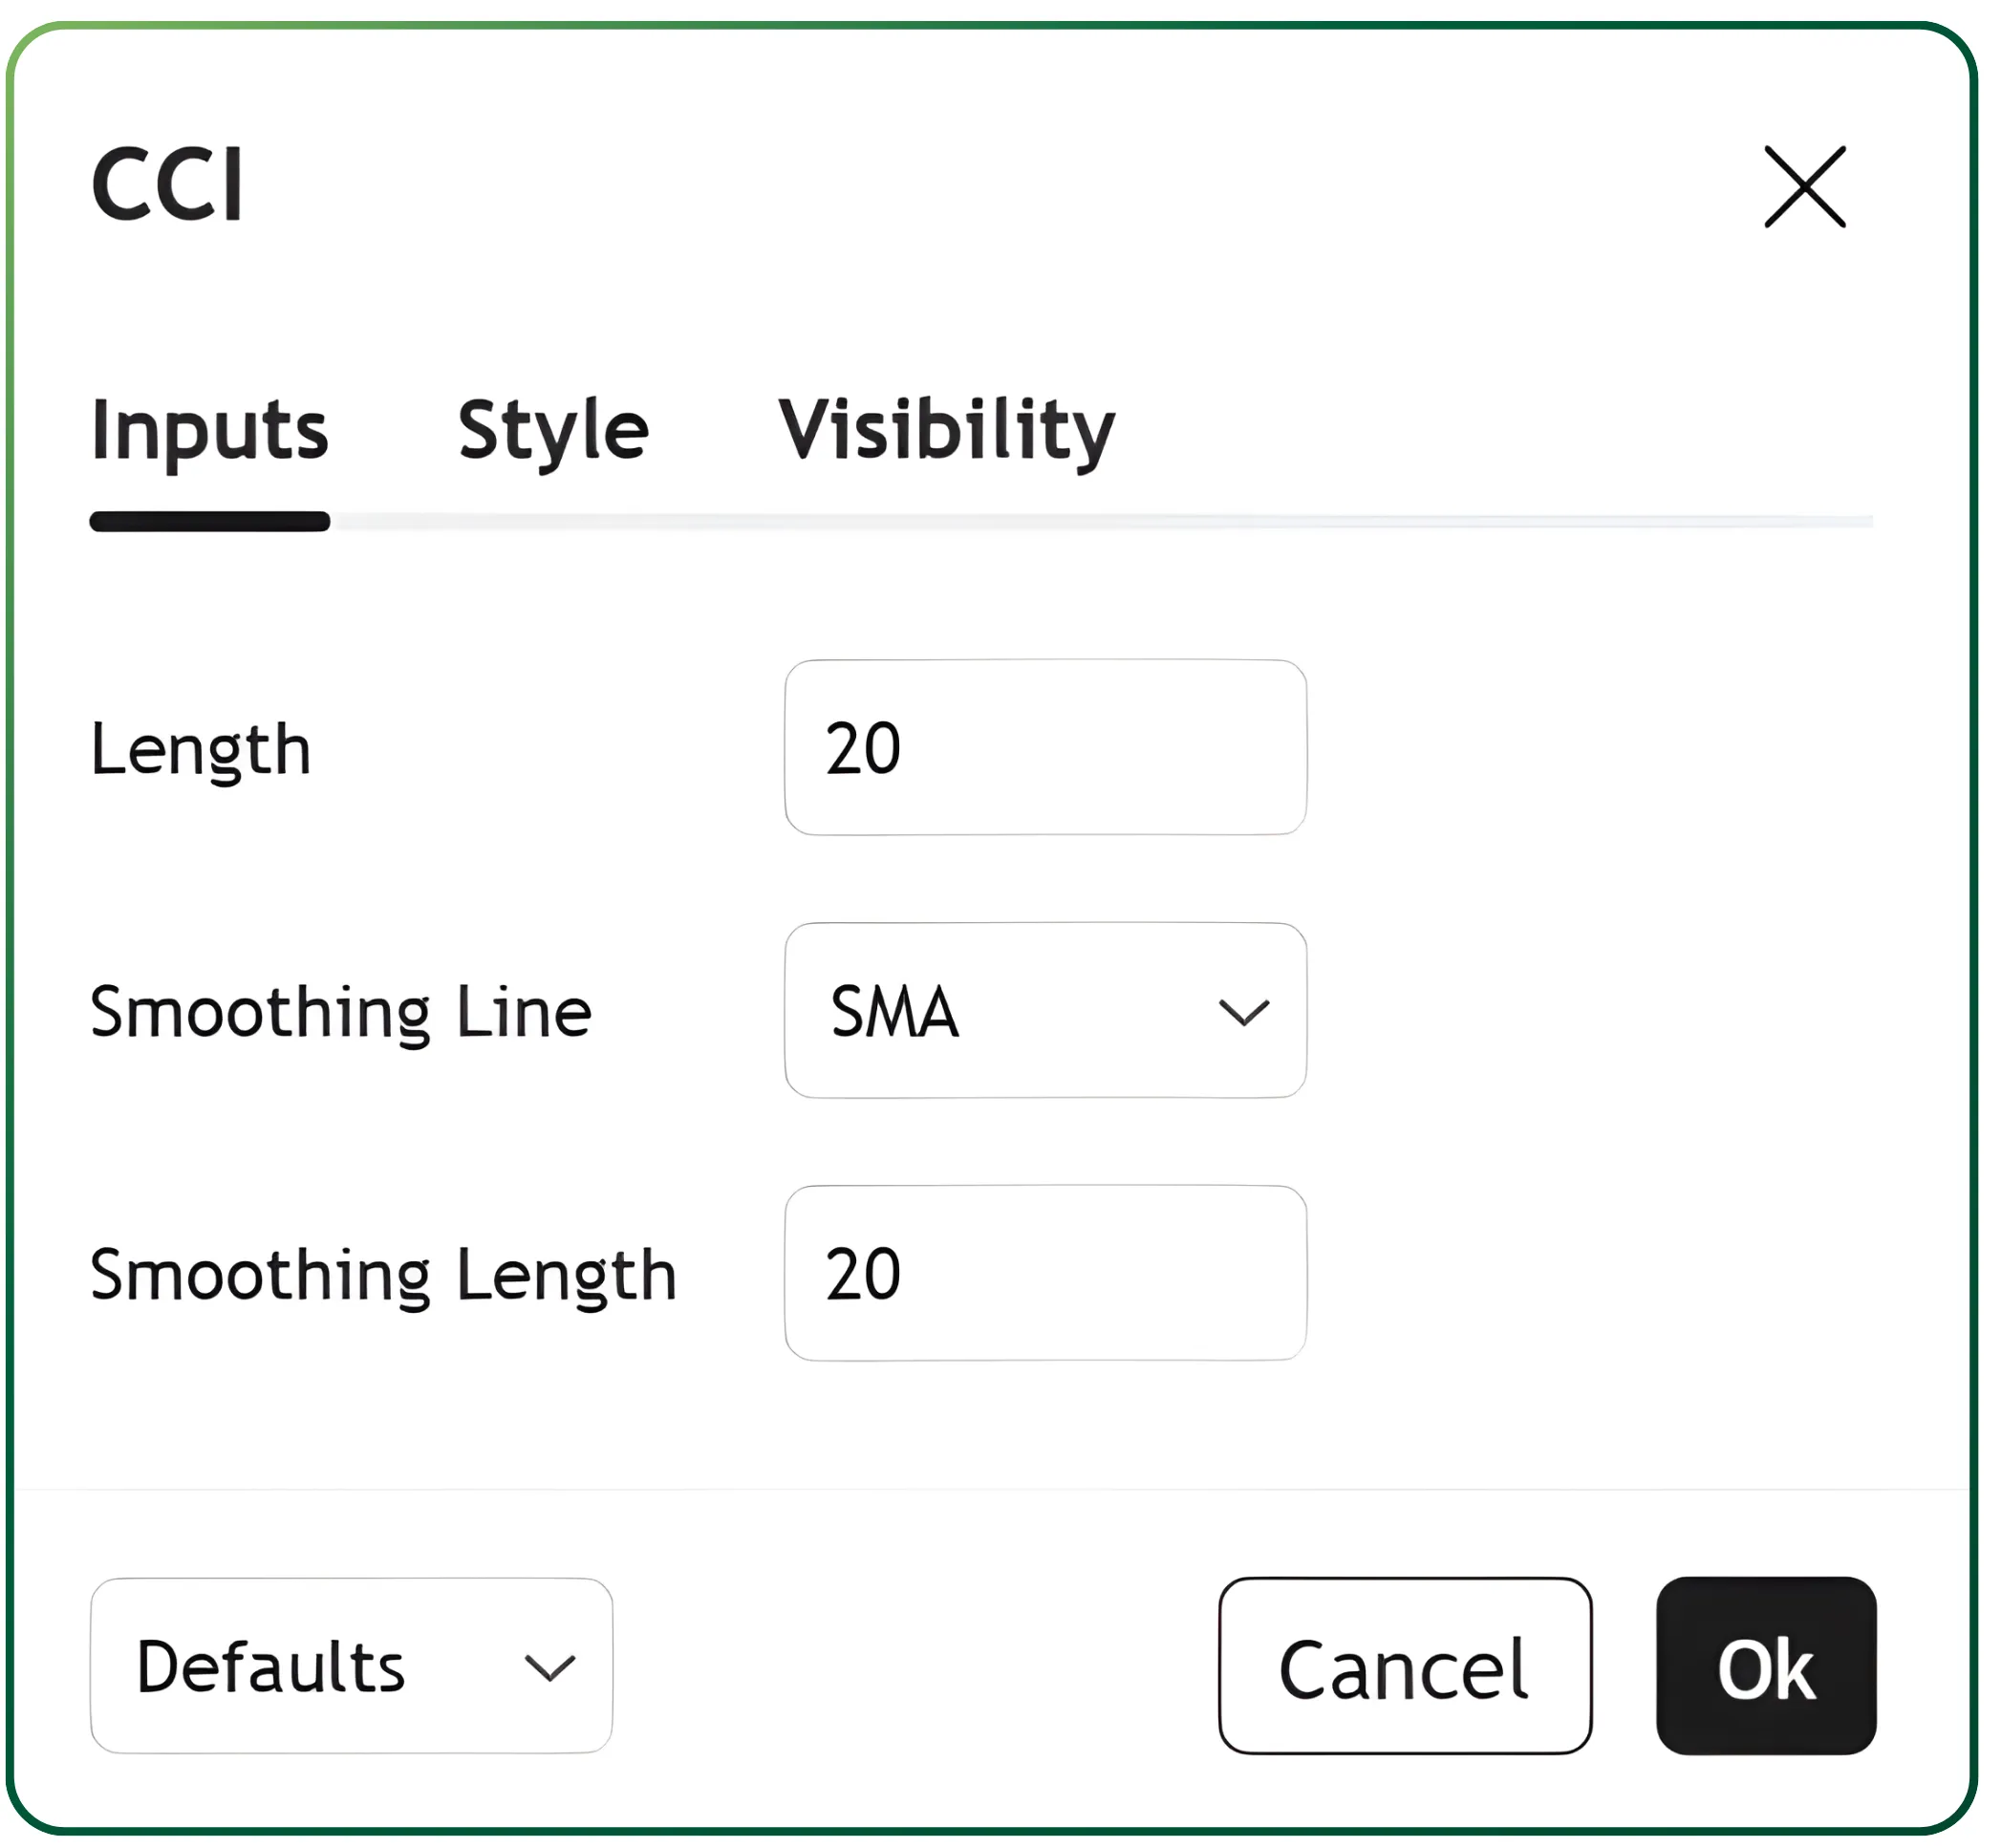
Best settings for CCI indicator
The standard setting for CCI is 14 periods, but traders often adjust based on style:
Short-term/day trading → 10 or even 5 periods to capture quicker moves.
Swing or positional trading → 20 to 30 periods for smoother, more reliable signals.
This setting can be changed from CubePlus from setting section as shown in below image.
Using CCI across trading styles
Day traders especially use CCI alongside shorter moving averages to identify rapid changes in price momentum, while longer-term traders prefer combining CCI with trendlines and moving averages to spot broader cycles and confirm sustained directional moves with higher accuracy.
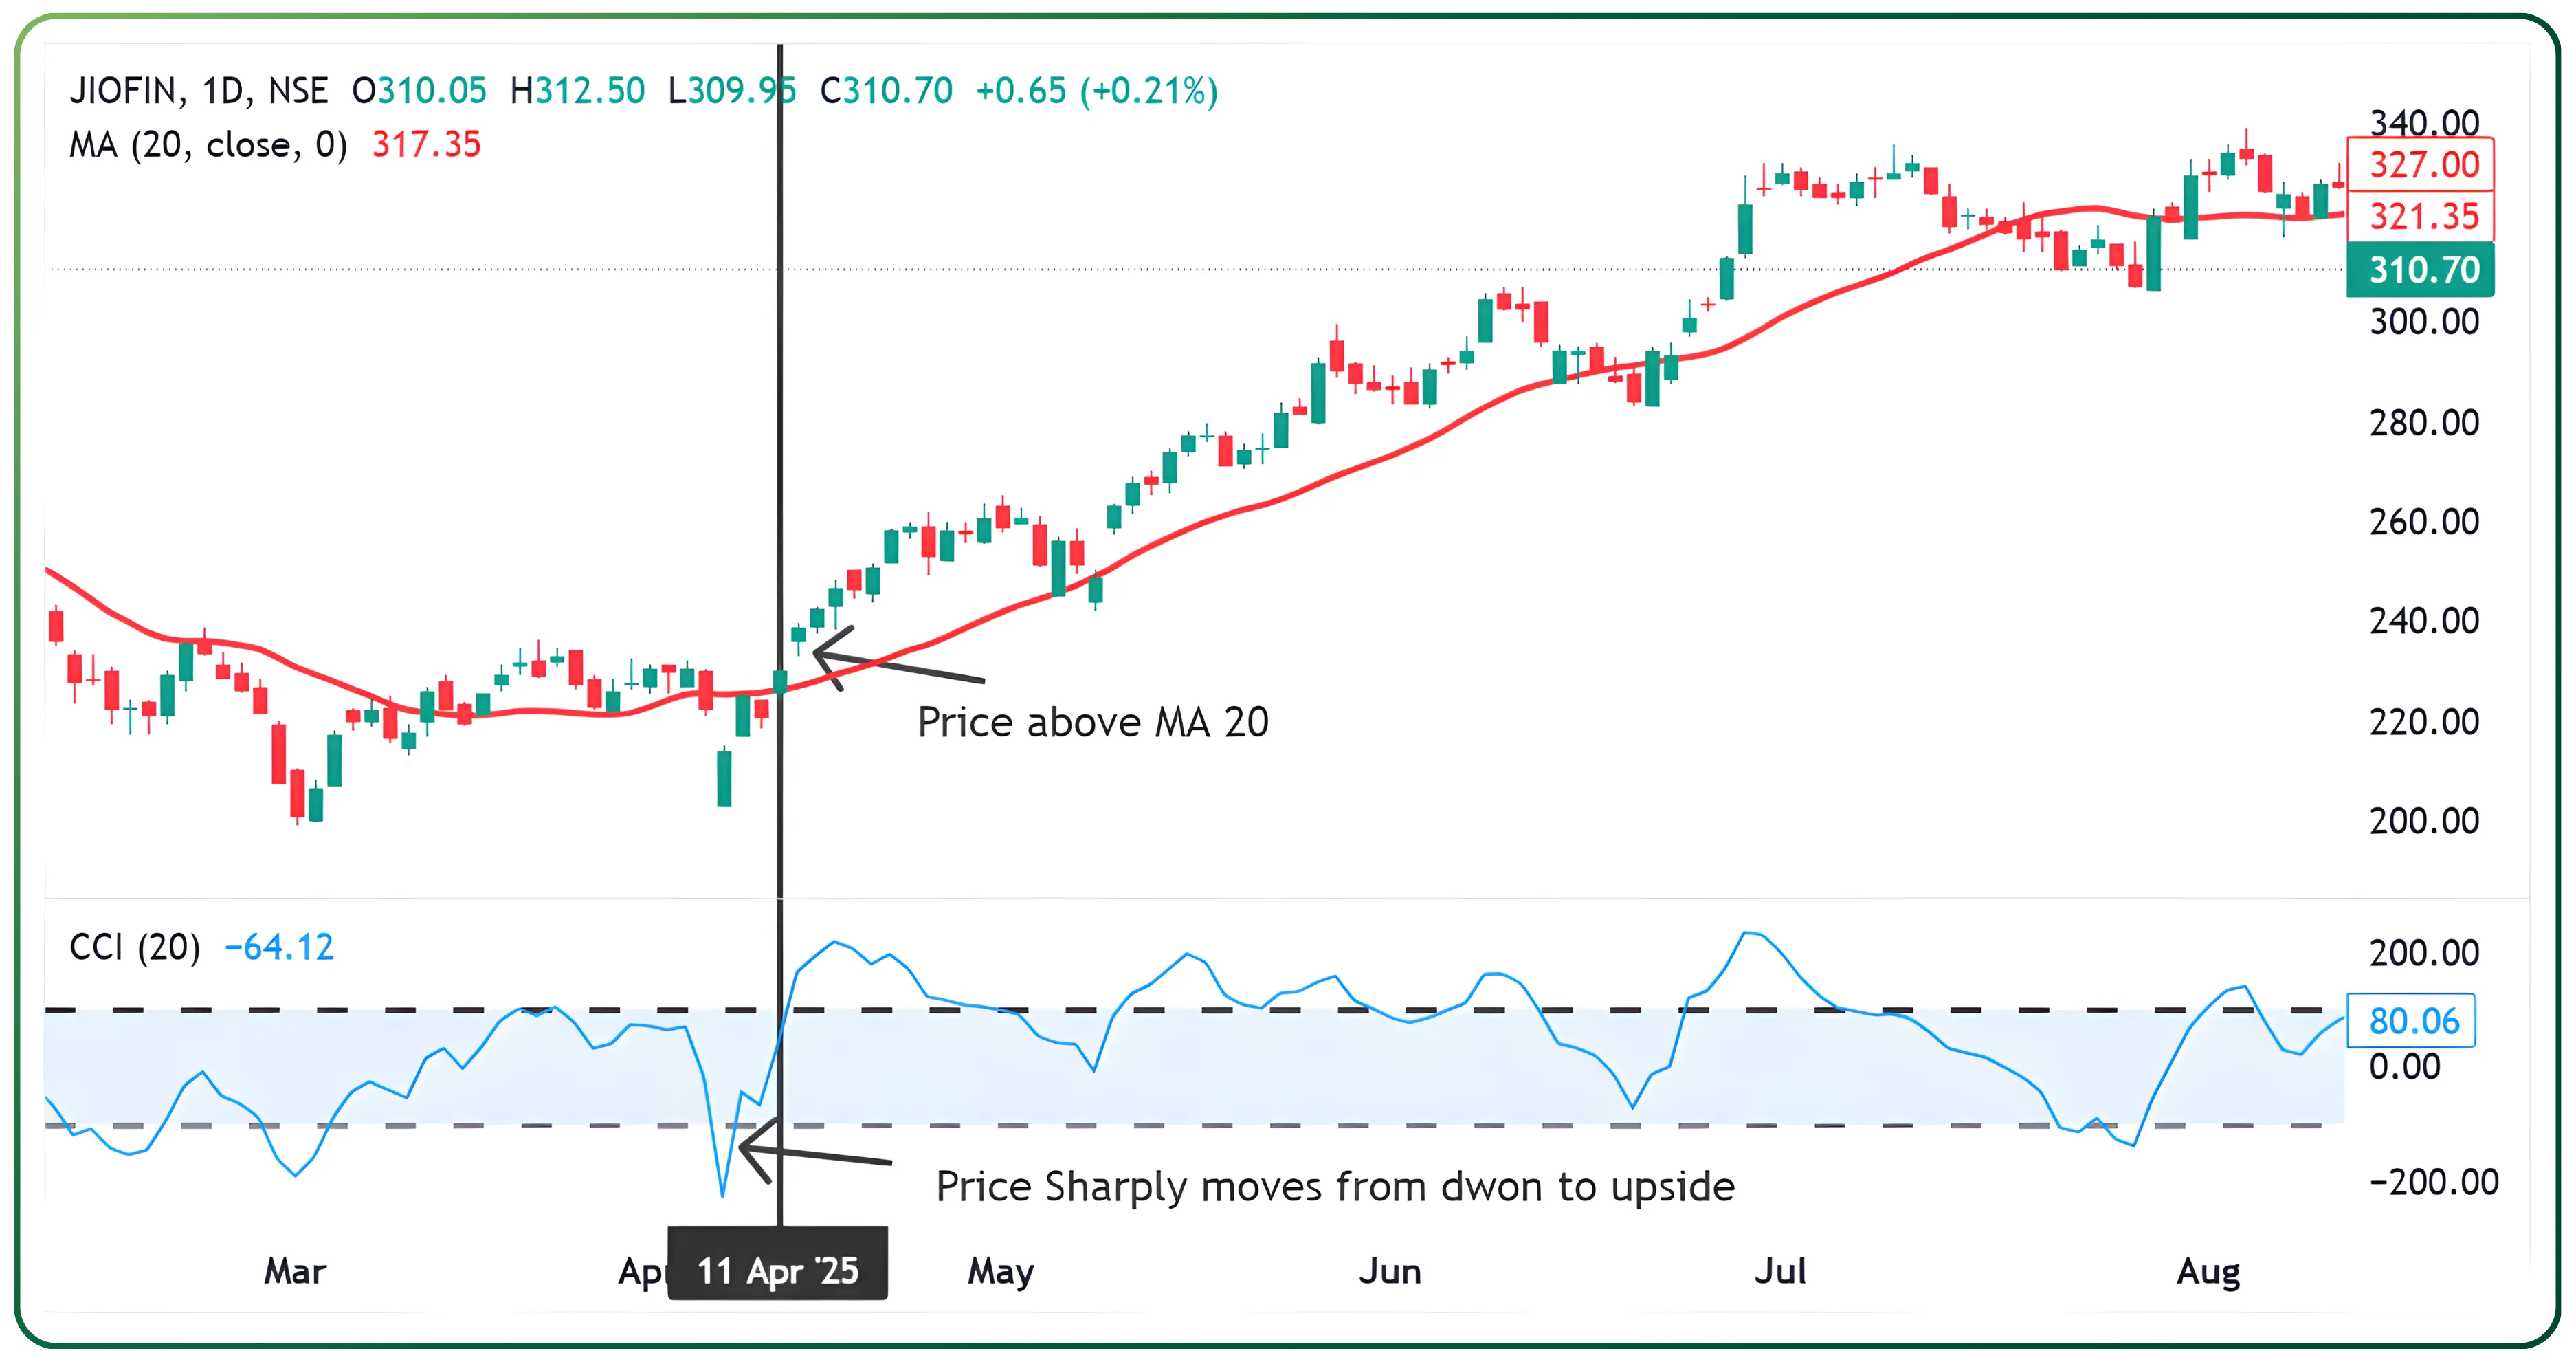
On 7th April, the CCI indicated that downside momentum was fading in JOIFIN. When combined with the 20-day Moving Average, the price closed above the MA20, providing additional confirmation for a long entry. The trade was triggered at ₹237, with the exit placed near the earlier resistance at ₹312, resulting in a gain of almost 70 points.
This highlights how using CCI alongside a supporting indicator like a moving average can increase confidence in entries and improve trade reliability.
Why traders use CCI in technical analysis
Identifies overbought and oversold levels.
Highlights early warnings of trend reversal.
Effective across multiple asset classes.
Complements moving average strategies and other oscillators.
Provides insights into market psychology and cyclical tendencies.
The role of CCI in modern trading
The Commodity Channel Index stands out as a flexible momentum oscillator that adapts to different trading environments. While it may not always provide perfect signals, its ability to track cyclical tendencies and detect divergences makes it a powerful addition to any trading strategy. By combining CCI trading rules with support and resistance zones, moving averages, and market psychology insights, traders can improve their decision-making process and strengthen trading confidence. Ultimately, the CCI helps stock traders align entries and exits with shifts in price momentum, ensuring that technical analysis remains both disciplined and adaptive in fast-moving markets.
Ready to apply these strategies in real markets? Get started with CubePlus and open your account and begin your journey toward smarter, goal-driven trading. Join now and trade with clarity, confidence, and an edge.
Disclaimer: The information provided in our blogs is for informational purposes only and should not be construed as financial, investment, or trading advice. Trading and investing in the securities market carries risk. Always conduct your own research and consult with a qualified financial advisor before making any investment decisions. Past performance is not indicative of future results. Copyrighted and original content for your trading and investing needs.
© 2025 — Tradejini. All Rights Reserved.